
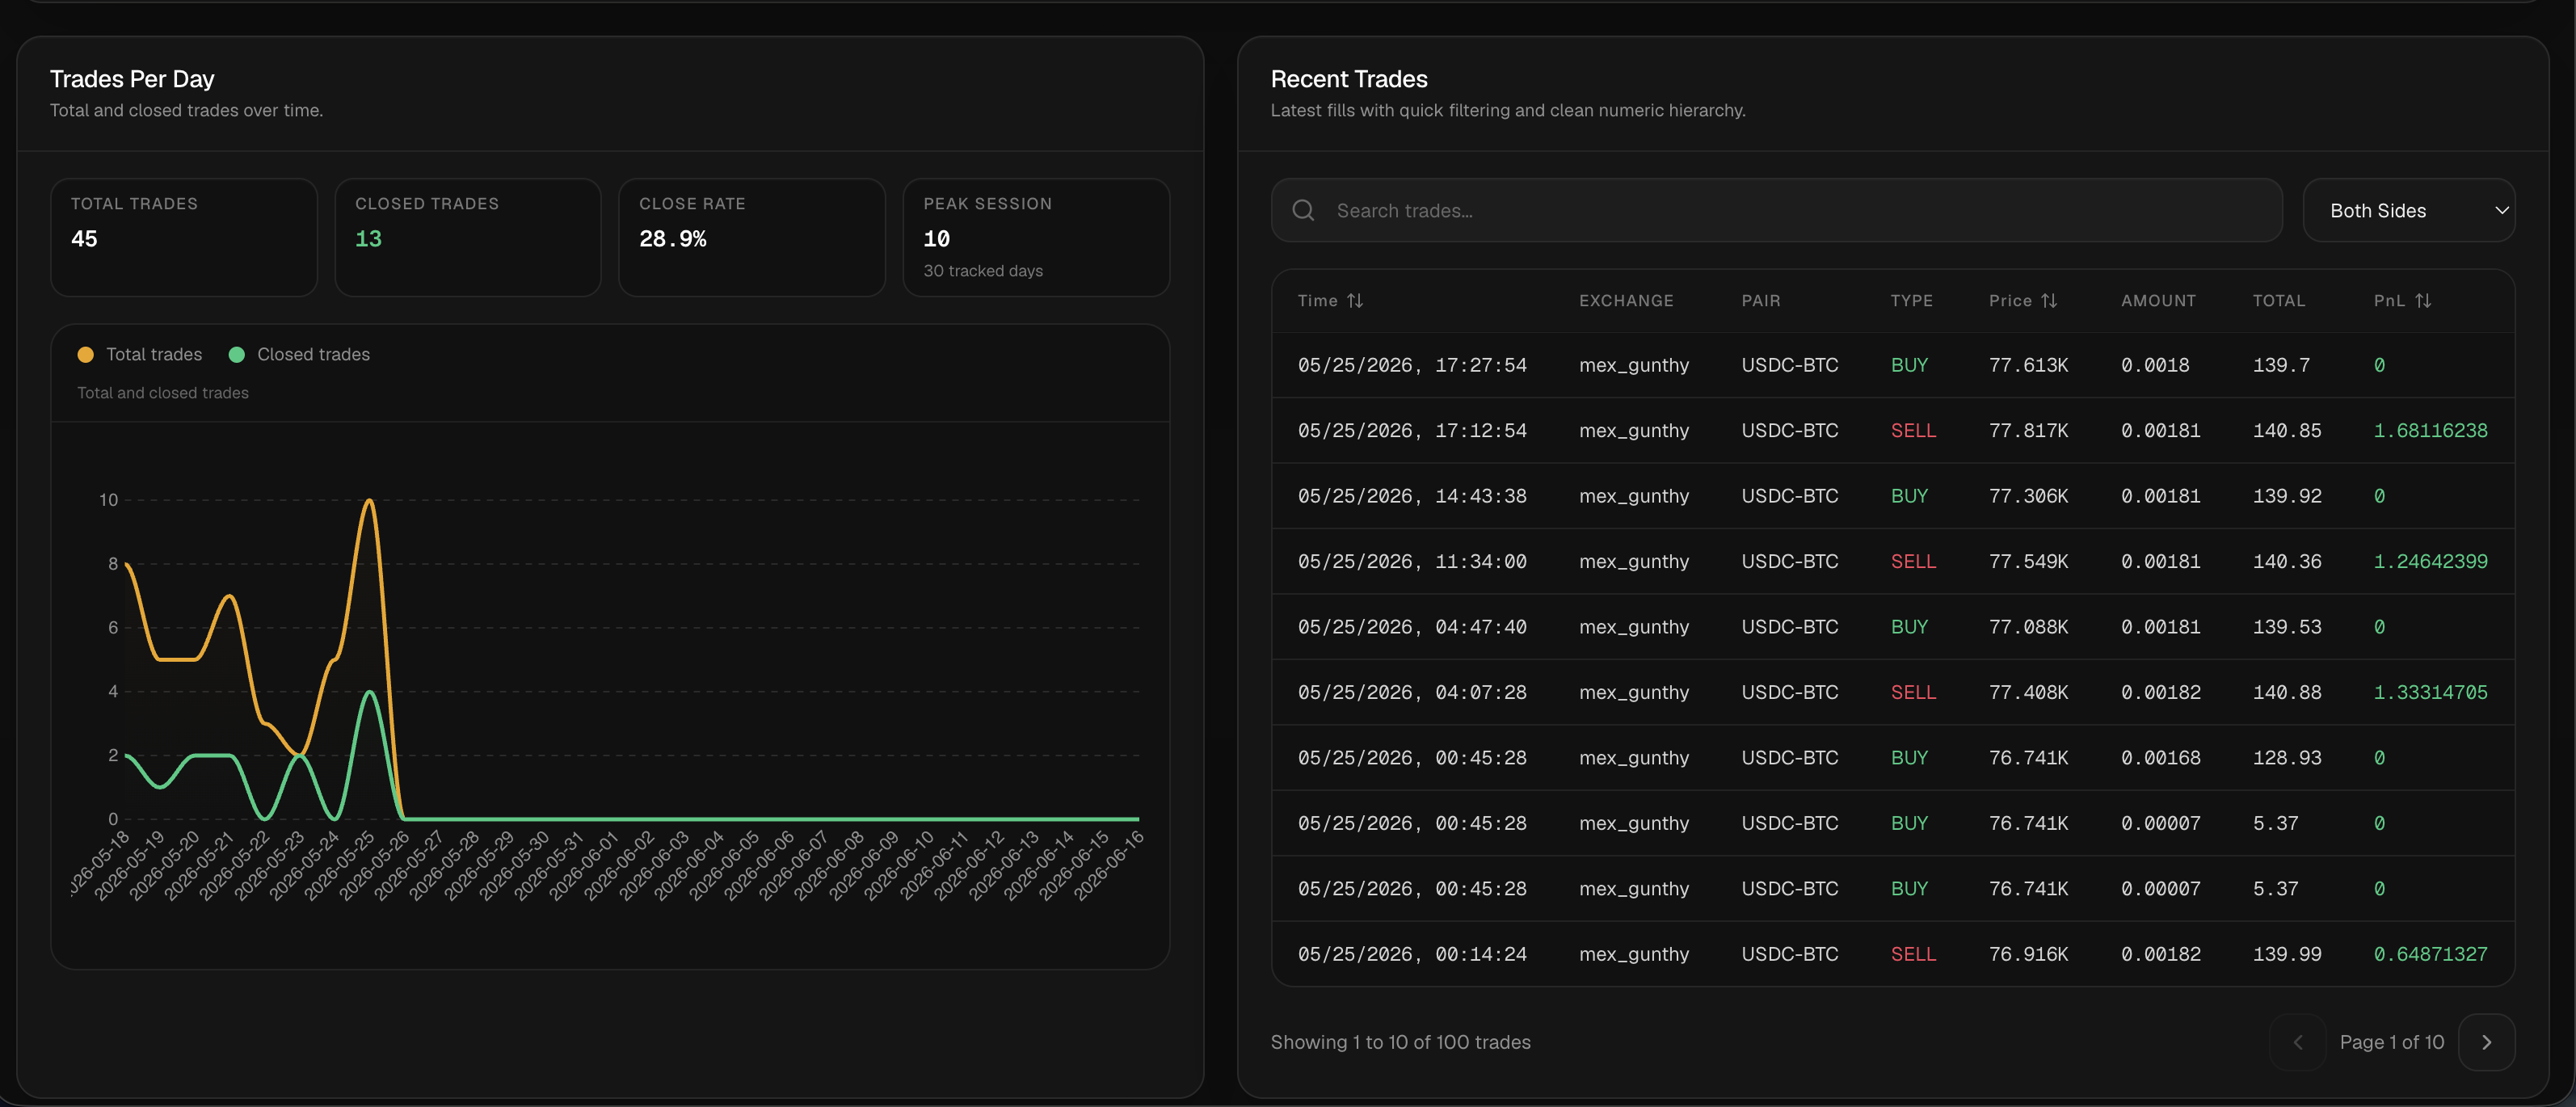
Deep strategy statistics help you review how a strategy behaves: trades, realized PnL, drawdown, time in market, exposure, fees, expectations, and other performance detail when present. The goal is to make strategy behavior inspectable, comparable, and debuggable instead of treating profit or loss as a black box.
What This Feature Does
Strategy statistics should explain behavior, not just show whether the last result was green or red. Use them to connect settings, market regime, fees, exposure, drawdown, history, backtesting, and risk detail into a clearer picture of how the strategy is behaving.
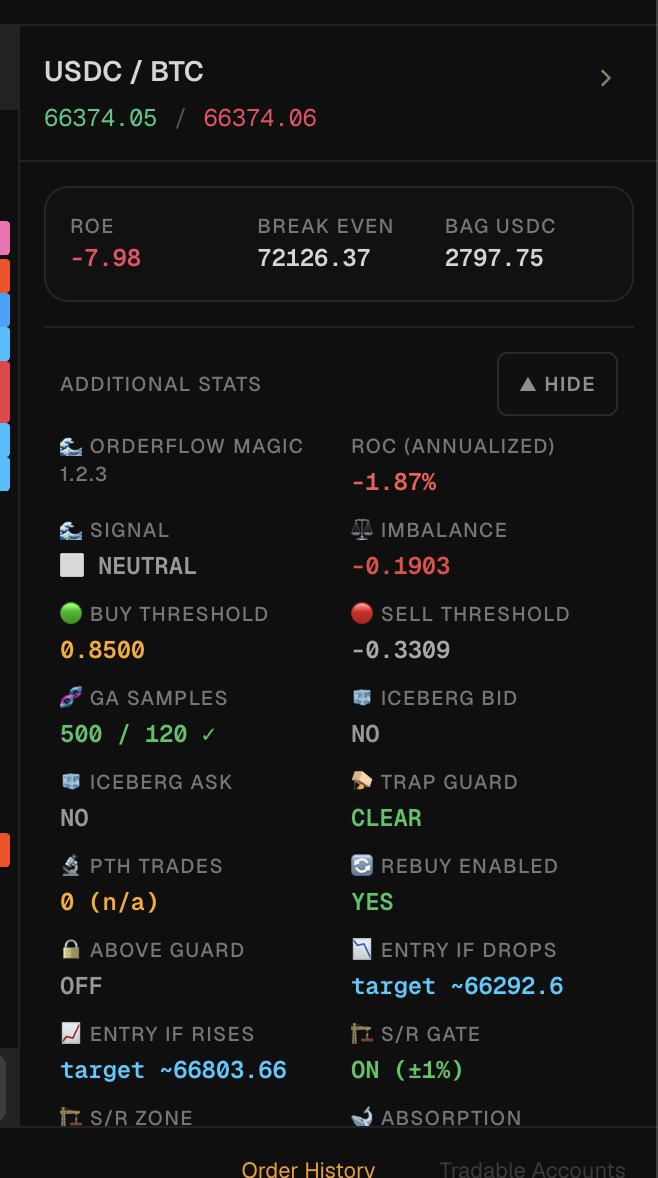
Example Metrics
A useful review looks past the headline result. Realized and unrealized PnL matter, but so do drawdown, time in market, exposure, fees, average and maximum capital deployed, and the ledger rows that show how buys and sells actually happened.
Limitations
The limits matter: Statistics depend on clean history and reliable exchange data. A profitable period can still be overfit or temporary. Statistics describe behavior; they do not guarantee future performance.
Trading Reality
It gives Gunbot a browser workspace for monitoring, strategy work, backtesting, risk review, history, and exchange-connected operations. These pages explain what the product does. Your account data stays on your local trading bot, behind login.
Operational Limits
The dashboard depends on the connected Gunbot instance, the exchange API, and the network between them. It can make problems easier to notice, but it does not remove market risk or take responsibility away from you: exchange permissions, strategy settings, open orders, and capital allocation still need your review.
Plain Definition
Deep strategy statistics turn bot behavior into inspectable evidence. You need more than a green or red result. Check trade count, average exposure, maximum deployed capital, time in market, fee drag, drawdown, win/loss behavior, and a ledger that shows how the result was produced.
Metrics That Matter
Net PnL and realized PnL show outcome, not the risk used to get there. Read them with drawdown, fee drag, time in market, average and maximum capital deployed, and expectancy per sell so the result explains both performance and exposure.
Bad Statistics Smells
Statistics deserve suspicion when fee drag is larger than the edge, a small profit hides a large drawdown, one large win covers many losses, live drawdown is much worse than the backtest, or the history behind the metrics is incomplete or corrupted.
How To Use Statistics Before Changing Settings
You should look for the failure pattern before changing parameters. If losses come from spread, lower the spread sensitivity or exchange choice may matter. If losses come from holding too long, exits or stops may matter. If fee drag dominates, target size or trade frequency may matter. If drawdown dominates, sizing, stop logic, or market selection may matter.
FAQ
Can statistics make a strategy safe?
No. They help you inspect behavior and risk, but market risk always remains.
Are statistics useful for custom strategies?
Yes, when the custom strategy produces trading behavior and history that the dashboard can analyze.
Why is fee drag important for scalping strategies?
Scalping can generate many small trades. If each trade has a narrow target, fees and spread can consume most or all of the theoretical edge.
Can deep statistics identify overfitting?
They can expose warning signs such as fragile edge, high fee dependence, poor out-of-sample behavior, or results concentrated in a small number of trades, but they cannot prove future resilience.
Last updated: