
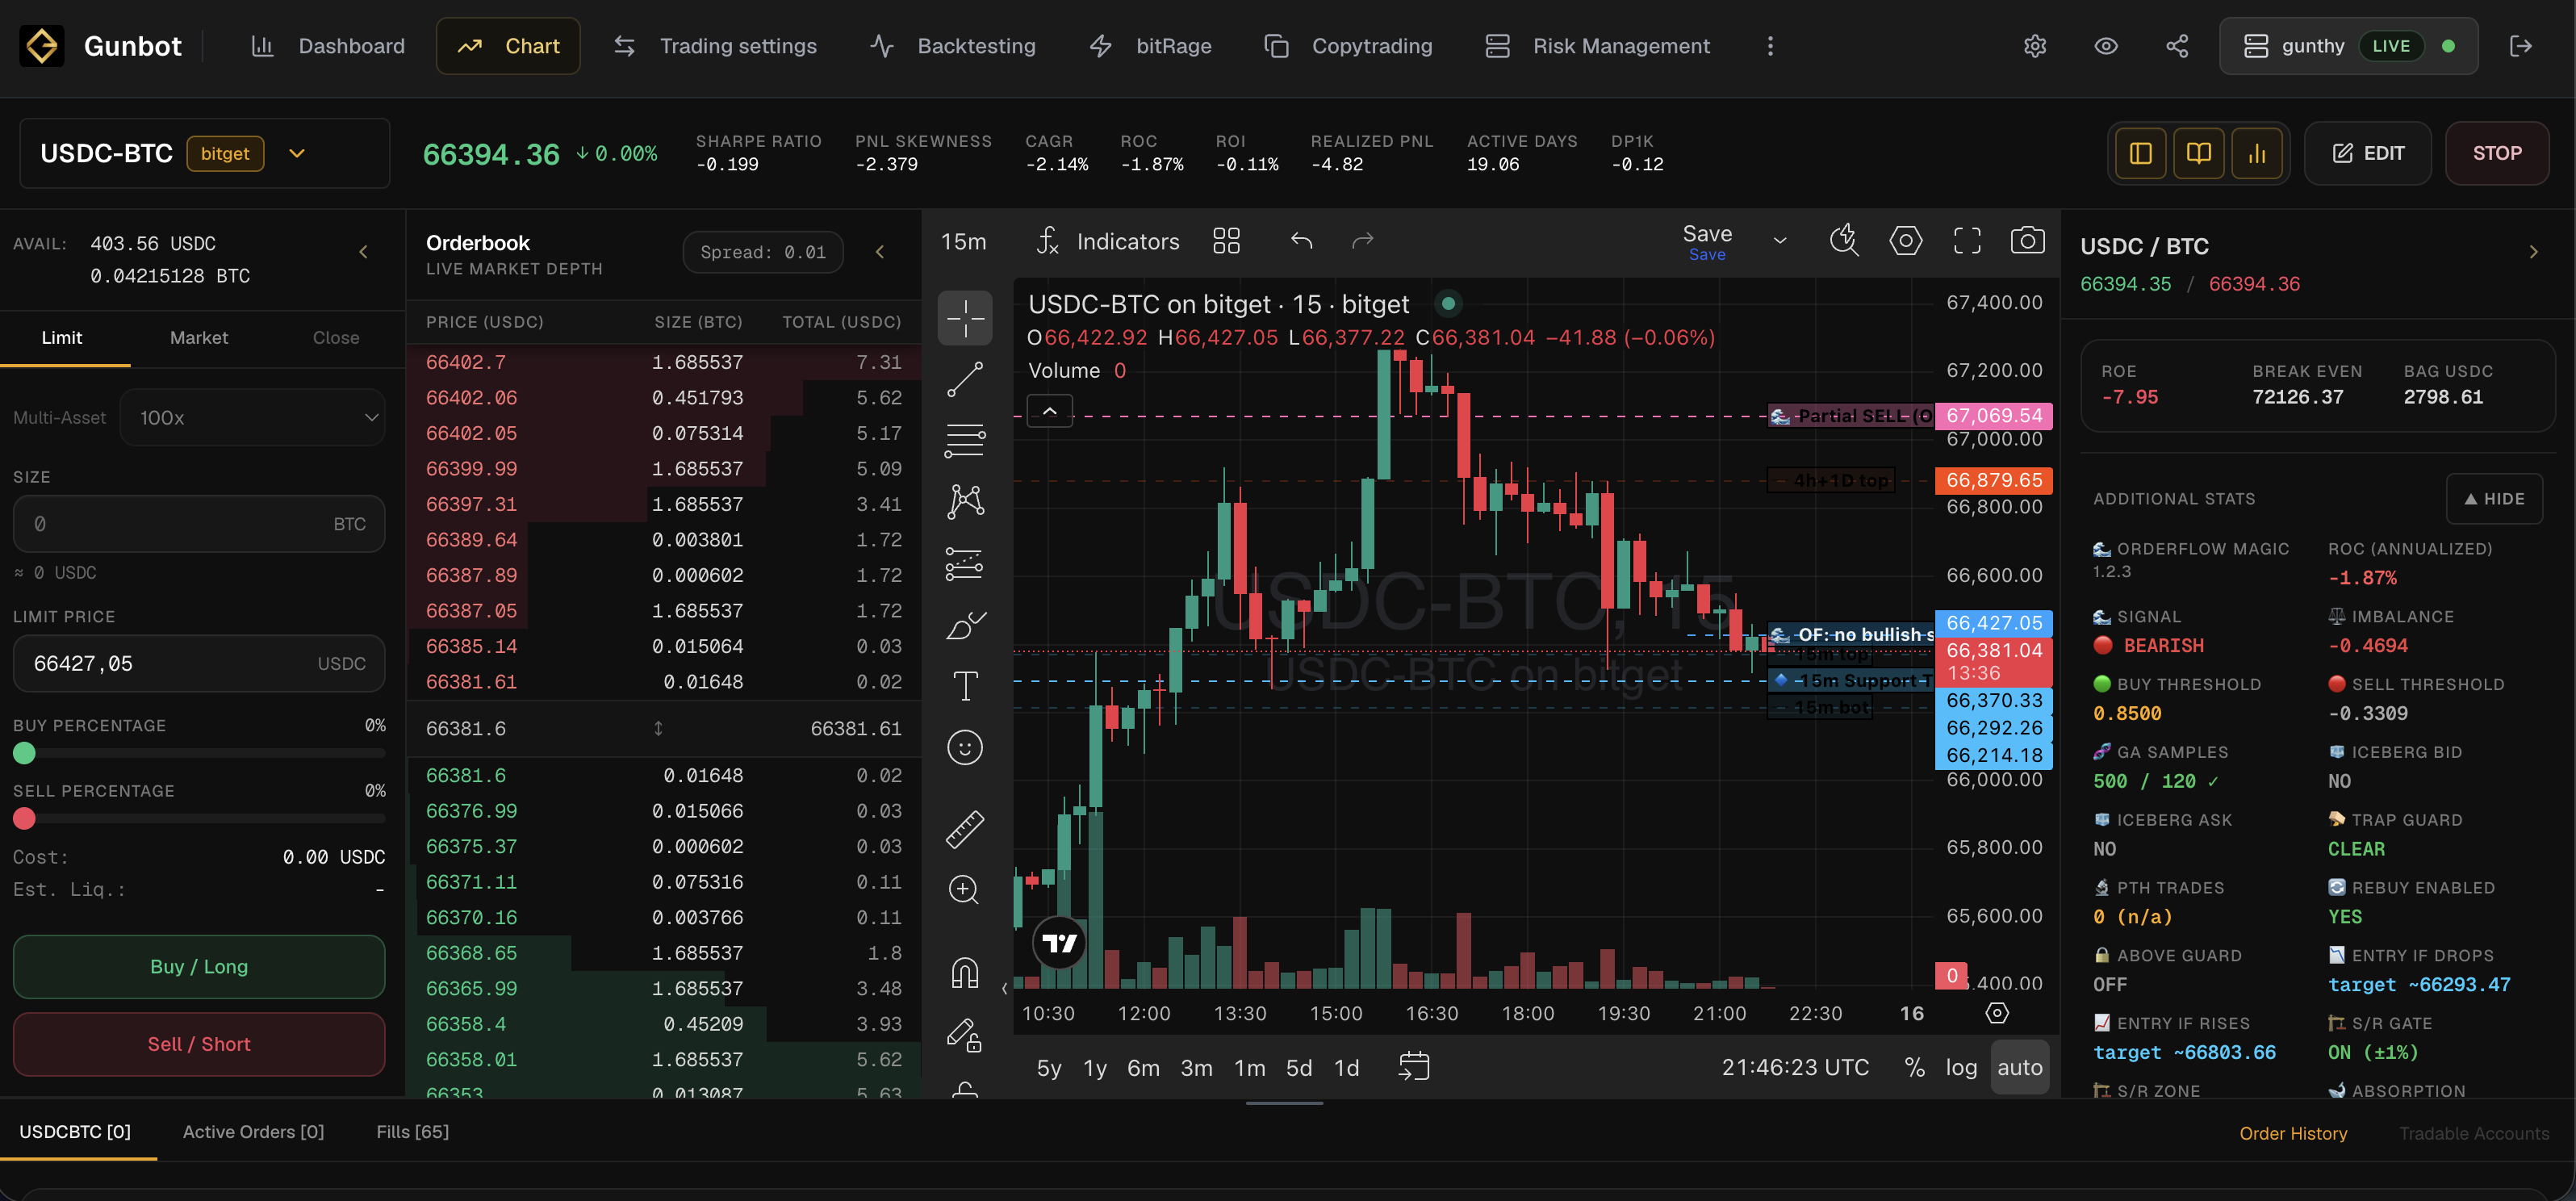
Low-lag charts give you a faster visual view of price action, candles, indicators, fills, orders, and strategy detail. They help you review live market state and spot mismatches between market movement, fills, and bot behavior without relying only on exchange screens or delayed logs.
What This Feature Does
Charts are most useful when they sit next to the bot context. You can look at candles, indicators, fills, and order markers next to the trading dashboard, so a market move can be reviewed together with what the bot did around it, and what its next trading targets are.
Example Workflow
You see a position open, check the chart immediately, compare recent fills with current price action, and decide whether the setup still matches the intended strategy behavior.
Limitations
The limits matter: Chart speed still depends on browser performance, data source, exchange limits, and network state. Charts are review tools, not predictions.
Trading Reality
It gives Gunbot a browser workspace for monitoring, strategy work, backtesting, risk review, history, and exchange-connected operations. These pages explain what the product does. Your account data stays on your local trading bot, behind login.
Operational Limits
The dashboard depends on the connected Gunbot instance, the exchange API, and the network between them. It can make problems easier to notice, but it does not remove market risk or take responsibility away from you: exchange permissions, strategy settings, open orders, and capital allocation still need your review.
Plain Definition
Low-lag charting means reducing the delay between market movement, bot state, and your inspection. The goal is not to predict price, but to make price action, fills, active orders, indicators, and strategy detail easier to review while the market is moving.
What To Inspect On The Chart
A chart should help you connect price action with bot behavior. Look at recent candles and volume around the last fill, whether orders happened near the expected levels or markers, whether the selected pair and timeframe match the order history, and whether price is moving faster than the strategy assumptions allow.
Where Low-Lag Charts Help
Low-lag charts are most useful during live review: after a fill, before a manual intervention, while checking an open order, when comparing strategy statistics to price action, or when deciding whether stale data might be hiding an execution issue.
Where Charts Can Mislead
A clean chart can still mislead you. It does not prove an exchange order is open, canceled, or filled; lower timeframes can exaggerate noise; indicators can lag or repaint; and almost any chart can make a bad strategy look obvious after the fact.
FAQ
Do low-lag charts guarantee execution speed?
No. Chart responsiveness is separate from exchange execution, latency, order routing, and API behavior.
Should I still check the exchange?
Yes. For critical account state, direct exchange verification remains important.
What does low-lag mean in a bot dashboard?
It means the chart should update quickly enough to be useful for trading review. It does not mean exchange execution is guaranteed to be instant.
Should you use charts or statistics first?
Use both. Charts explain market detail; statistics explain strategy behavior. You should compare them instead of trusting only one view.
Last updated: